
Analyze your Business performance with Maxx Insights. Use intelligent, data-driven BI dashboards to visualize key metrics and drive growth through informed decision-making.
Actionable Intelligence Better Decisions.
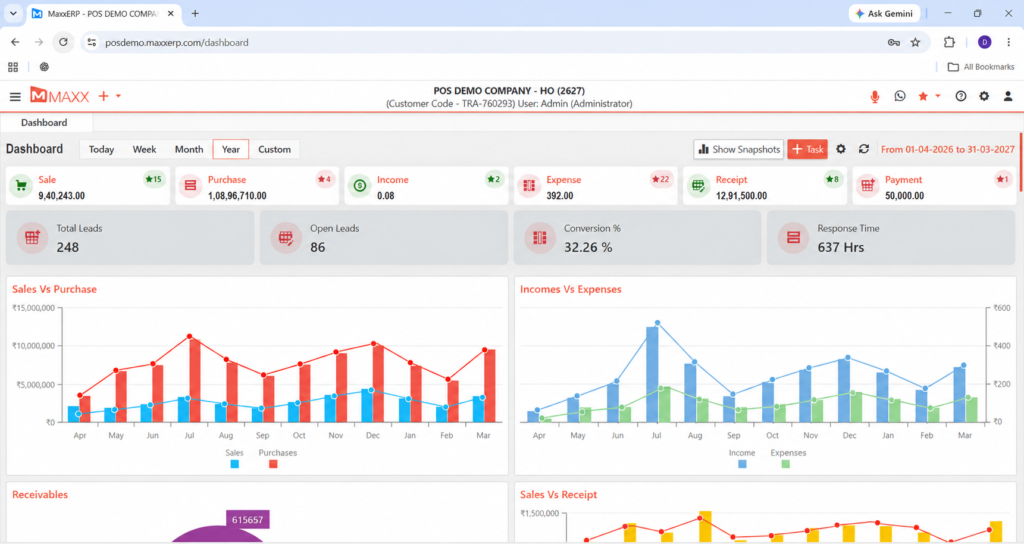
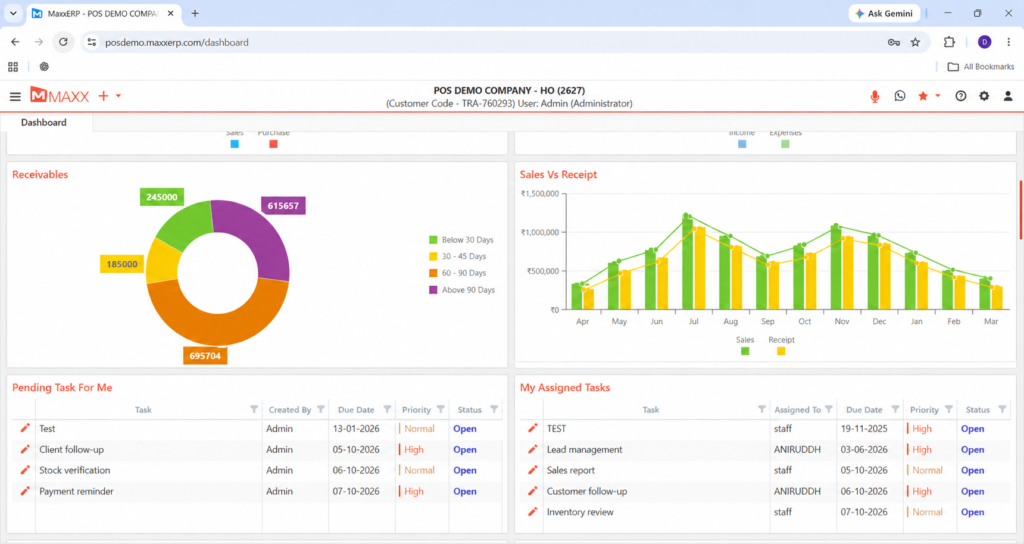
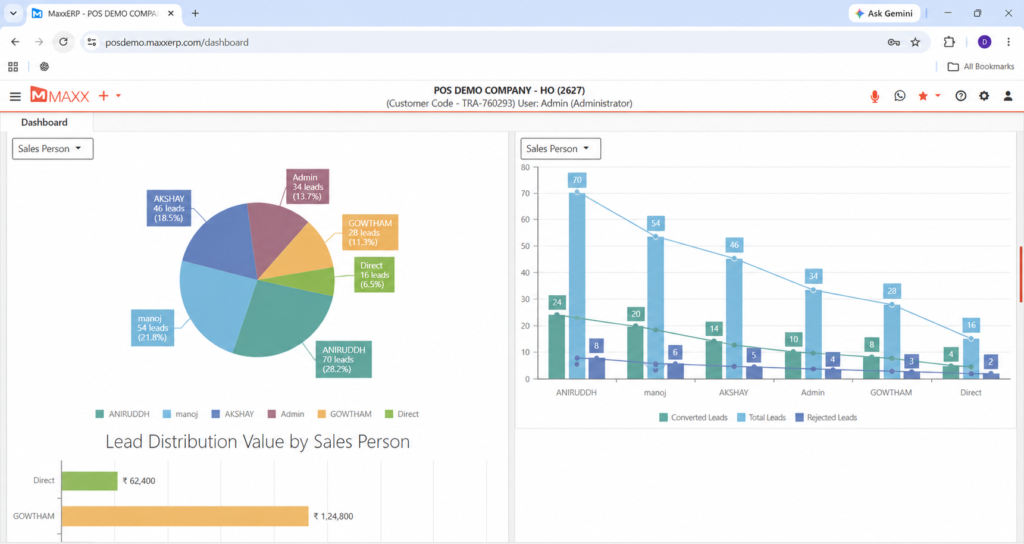
Maxx Insights converts operational data into visual intelligence for confident decision-making.
Who
Executives department heads and owners needing high-level company performance visibility.
How
Connect ERP data to intelligent dashboards visualizing sales financials and operational metrics.
When
Ideal for board meetings KPI tracking and product performance analysis.
Feature Highlights
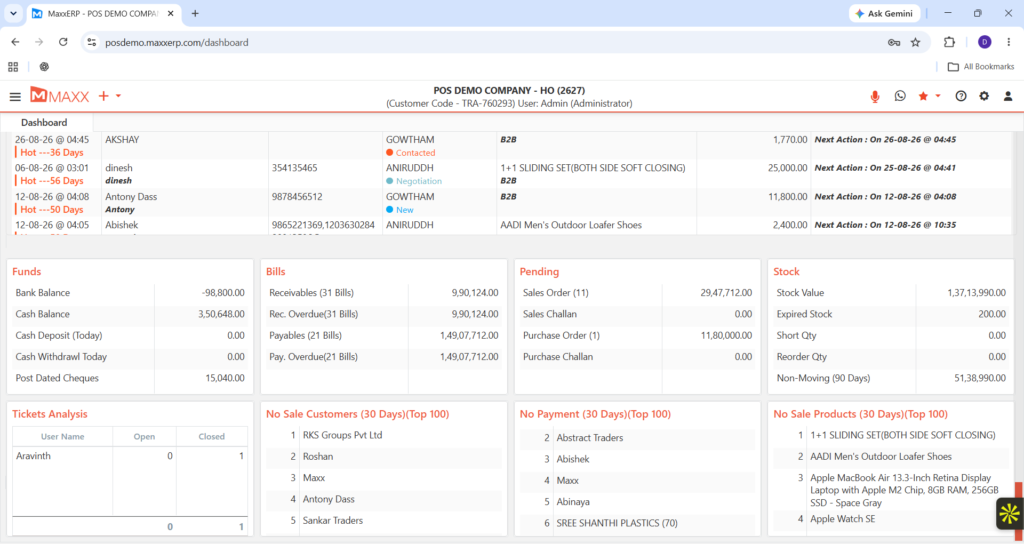
Advantages of Maxx Insights

Simplifies complex data.
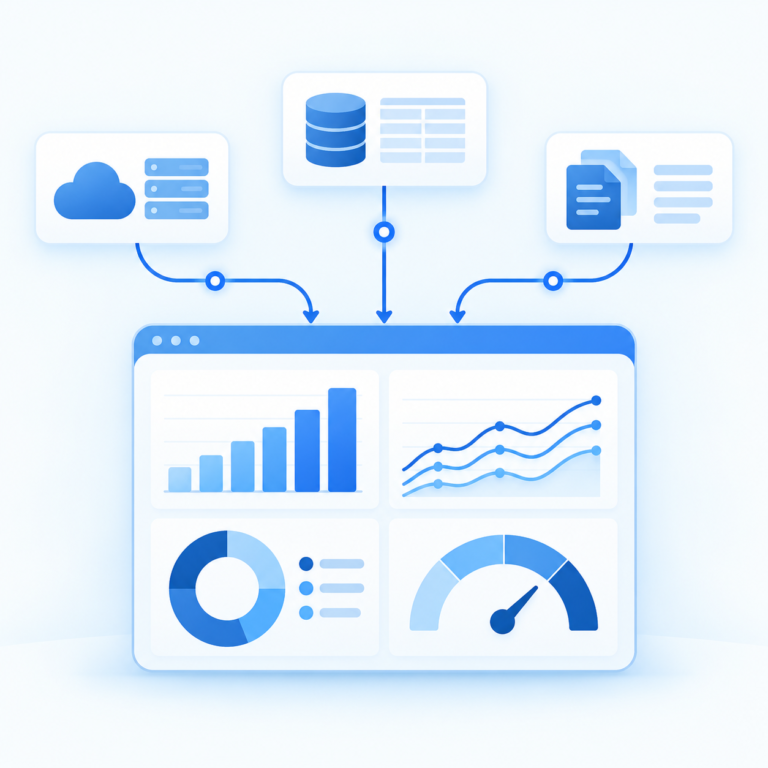
Provides unified performance visibility.
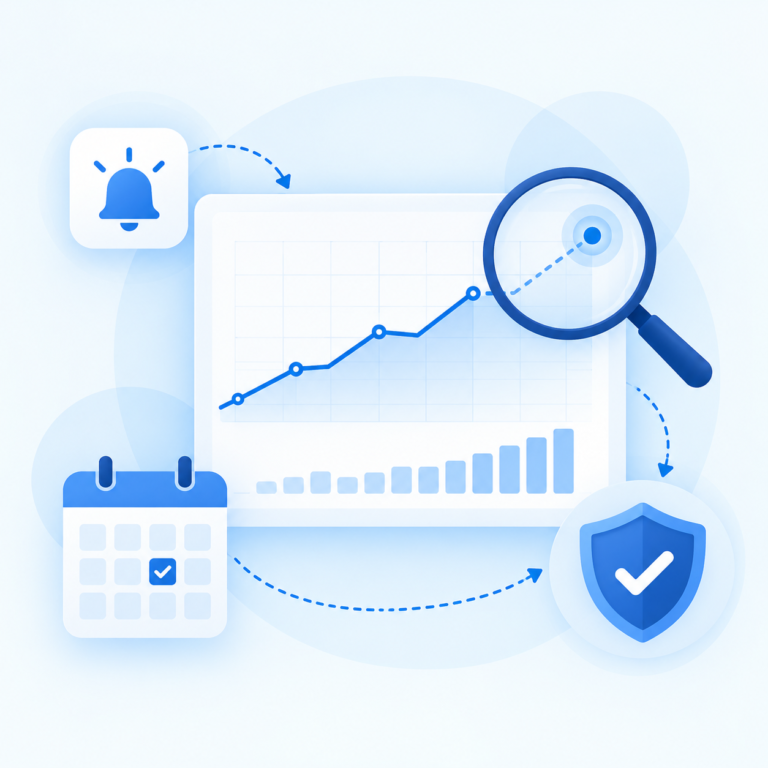
Enables proactive management.
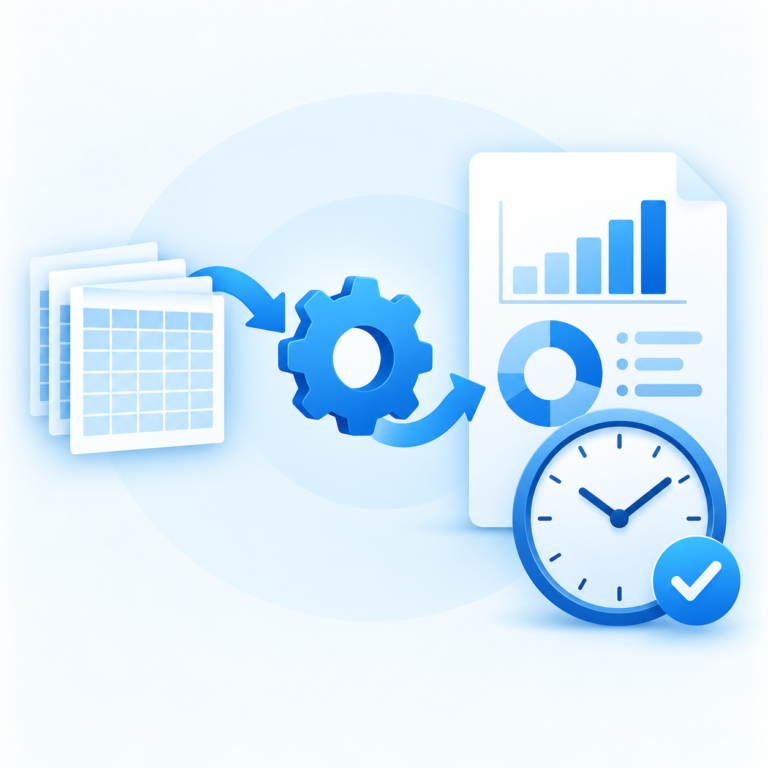
Saves hours of manual reporting.
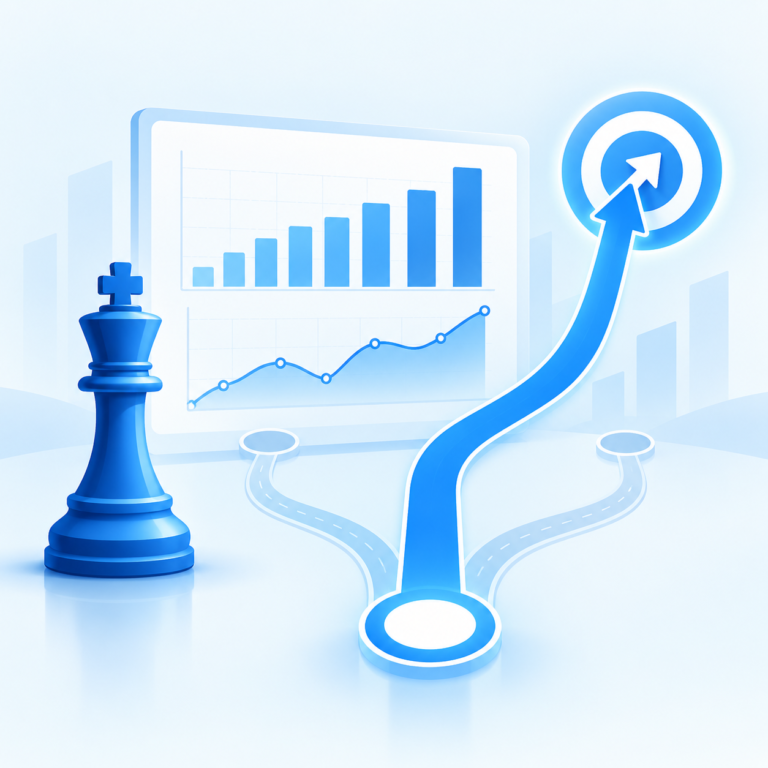
Empowers leadership decisions.
FAQs
It is an advanced Business Intelligence (BI) tool designed to help you analyze business performance through intelligent, data-driven dashboards.
By visualizing your data, it reveals hidden trends and performance metrics, allowing you to make decisions based on facts rather than guesswork.
Yes, the BI dashboards pull directly from your operational data to ensure your insights are always current.
Absolutely. Like all our professional modules, you can export your findings and reports to PDF or Excel for use in presentations or deeper analysis.
Yes, Maxx Insights is built within our secure ecosystem, ensuring your strategic data remains confidential. For more on national digital security standards, you can visit the Ministry of Electronics and Information Technology (MeitY).