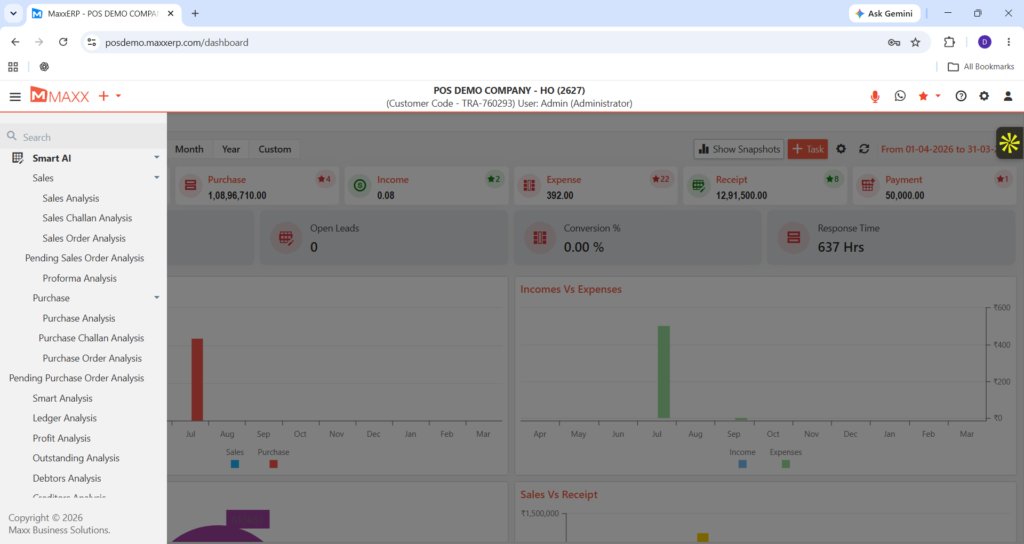
Gain deep insights with dynamic pivot reports. Maxx Smart Reports helps you analyze data from every angle to drive growth.

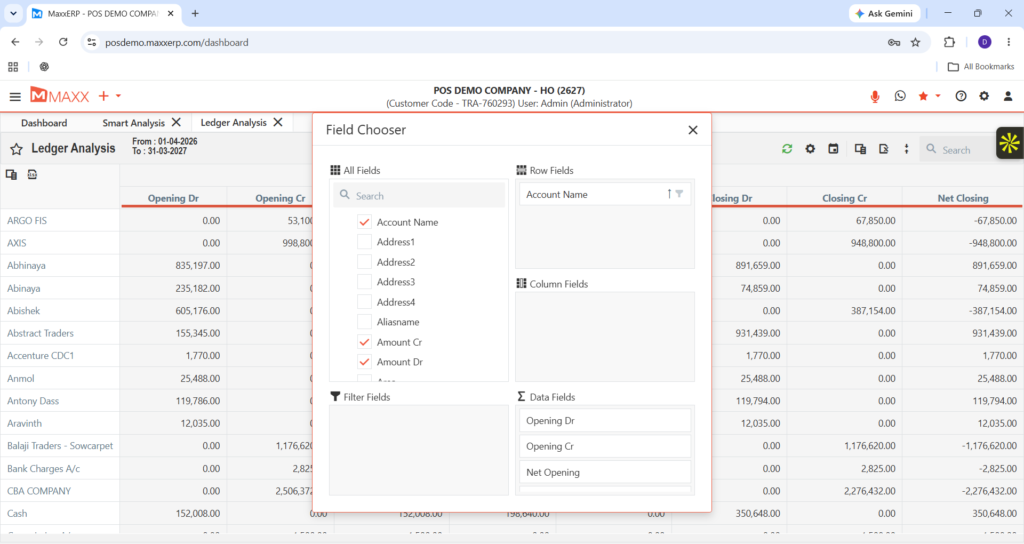
Turn raw data into insights with Maxx Smart Reports. Slice, analyze, and summarize instantly to stay ahead.
Essential for CEOs, CFOs, and data analysts who need to summarize complex datasets without manual spreadsheet manipulation.
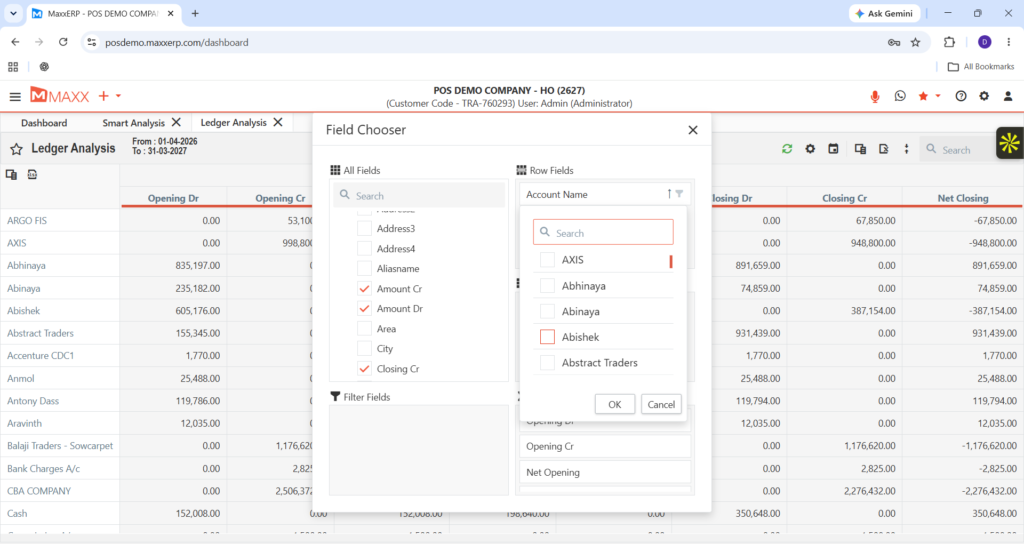
Drag and drop data fields within a dynamic pivot interface to create custom views of your sales, inventory, and financial performance.
Perfect for weekly performance reviews, identifying seasonal sales trends, or performing deep-dive audits into departmental expenses.
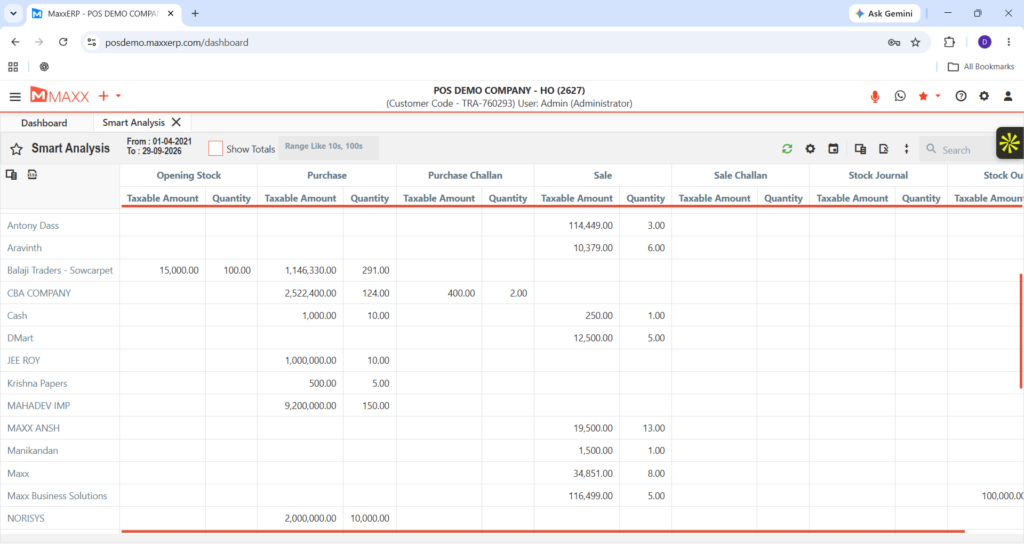
Create highly flexible reports that let you rearrange and summarize data on the fly.
Access up-to-the-minute business data directly from your ERP without waiting for manual processing.
Filter and group information by date, category, region, or any other critical business metric.
Easily identify growth patterns or bottlenecks through comparative data visualization.
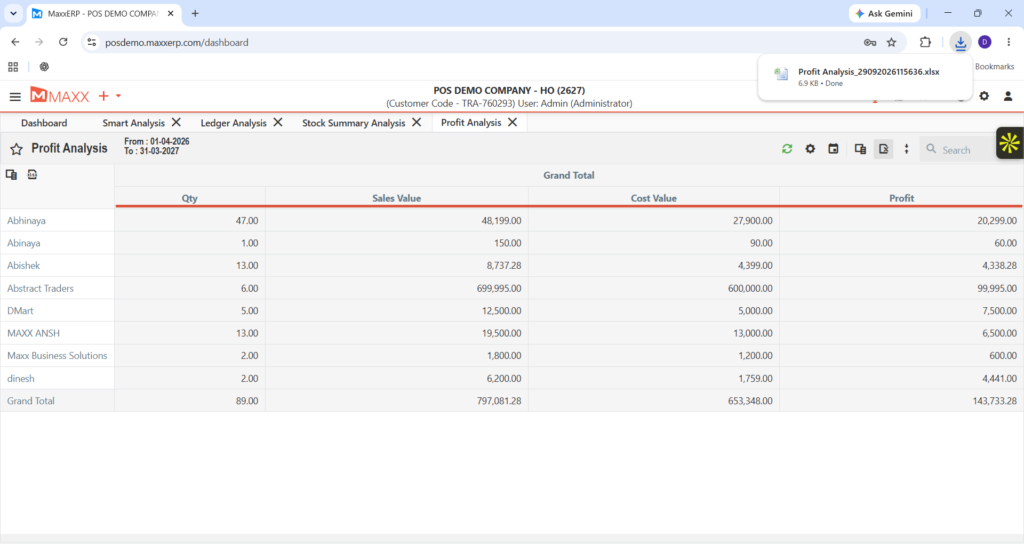
Save and share your findings by exporting reports directly to professional PDF or Excel formats.
Unlike static reports, Maxx Smart Reports use pivot-based analytics that let you interact with the data and instantly view it from different perspectives.
No. The interface is built for business users, allowing quick insights through a simple drag-and-drop approach.
Yes. Maxx Smart Reports combines data from multiple operational modules to give you a complete view of your business performance.
Yes. You can export your customized reports in one click to Excel or PDF for sharing in meetings or presentations.
Yes, your business intelligence is protected by the same enterprise-grade security as your core ERP system. For information on data protection standards, you can visit the Ministry of Electronics and Information Technology (MeitY).