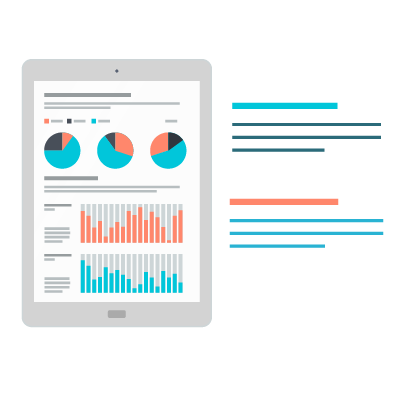
Graphical Business View = Wiser Decisions
Get quick multi-view graphical snapshot of your business with different entities involved in business execution, Get a 360 degree account / product view, Verify Key Performance Indicators, Monitor Entry Statistics, generate Monthly Business Summary in clicks, Analyse Fast/Slow moving Products/Customers, thus helping you take calculated risk as per existing data and make wiser decisions.
Introduction
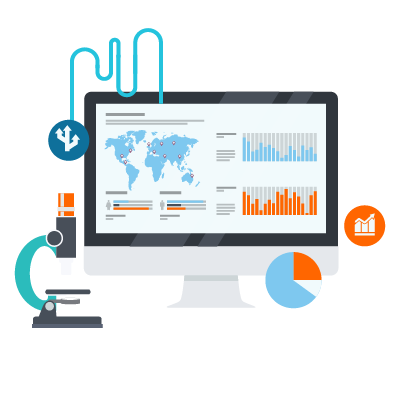
MaxxERP Business Dashboards & CEO Reports are for decision makers using which graphical analysis of Sales / Sales Person / Products / Customers can be done in clicks. These reports helps you to quickly find your Top / Bottom ‘N’ customers / products / vendors / city / sub group / all sub masters, Explore your Business Summary which summarizes monthly Net Sales / Net Purchase / Net Receipts / Net Payments, Study Users Performance and Entry Statistics, Examine Key Performance Indicators & Business Snapshots, Analyse FIFO based Cost of Goods Sold and Profit Analysis thus helping you to make wiser decisions.
- MaxxERP is a beautiful online Business Dashboards management software.
- Its very simple & easy to use Business Dashboards software over the cloud.
- Being a Web based Business Dashboards software makes it accessible anywhere over internet.
- MaxxERP is the best Business dashboards software system that can be used on Desktop, Web and Mobile.
- Manage your business Business dashboards related operations with Complete Clarity.
- MaxxERP is a secured online Business dashboards bookkeeping application on cloud for small businesses too.

Key Features
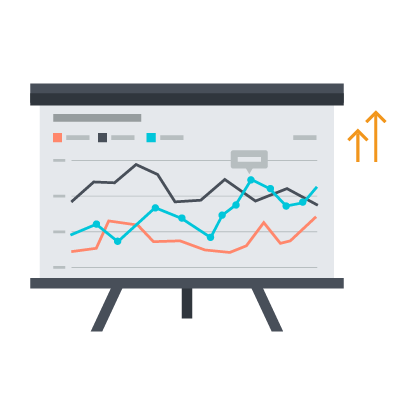
Awesome Dashboards for growing business
- Graphical Business Dashboards -
- Sales Dashboard
- Customers Dashboard
- Sales Person Dashboard
- Products Dashboard
- Targets Vs Actuals Analysis
- Budget Vs Actuals Analysis
- Key Performance Indicators
Super Set Of CEO Reports for wise business decisions
- 360 Degree Account View
- 360 Degree Product View
- Top ‘N’ Reports - Track Fast / Slow Moving Business Entities.
- Business Snapshot
- Day Glance
- Entry Statistics
- User Performance
- Discount Analysis
- FIFO Wise Profit Analysis (Smart Analytical Report)